
How does Market Intel work?
Keep up-to-date with what’s happening in your local property patch (or patches) with Market Intel. Patches are based on postal sectors (for example EH1 1 and EH1 2 for Edinburgh’s old town) and you can easily specify which to include by entering text or selecting from a map. You can also filter by property type/s, price band, and sales or lettings. Patches are quick and easy to create and just as easy to save.
Once patches have been saved, you’ll see what properties are new to the market, which have been reduced, which have fallen through and which are struggling to sell or let, as well as what is available overall and which are agreed. From this data, you can click through to a further breakdown of each category, which can again be filtered further, and PDFs and certificates can be generated.
If you don’t have a patch set up, you’ll see a button to create new patch at the bottom of your dashboard. Clicking the button will take you to the patch creation section, where you’ll be able to set this up.

To create a patch, you need to select the area where you operate and would like your reports tailored to. You also must complete the following fields,
Name
Give the patch a name, we recommend something that clearly describes the area and type of instructions covered. For example, ‘Maidstone Sales’ or ‘W1 Flats to rent’.
Department type
To compare and report on data across the area, we need to know whether you’re interested in sales or lettings.
Sectors
The patch needs to include at least 1 sector. A sector is the outcode and first number of the incode, ME15 6. You can add sectors using the map, simply by clicking on the sector you want to add. Once selected it will turn red. You can also search for an entire outcode or use the specific sector in the Sectors field. Once an outcode is selected, you can toggle which sector you want within it. You may select up to 30 sectors per patch.
Filters
There are two optional filters you can set when creating your patch.
Price
It’s possible to set a lower and upper price limit to further refine your patch. If you specialise in one aspect of the local market, this can be a way to narrow your patch and tailor reports to the part of the local market you’re most focused on.
Property types
The patch can be set to exclude types of property. If your business focus is on certain property types, you can use this filter to refine the patch to those most relevant to you.
Once all criteria are completed, click the save option.
After you’ve saved your patch, you’ll be directed to the Patch management screen. Here you’ll see the percentage of properties from your portfolio that feature in the patch you’ve created.
We recommend creating patches that cover the majority of your inventory to ensure the reports provided are relevant to you.
From your dashboard within the Your patches sections, select Manage patches to navigate to the Patch management screen.
On this screen you’re able to perform a number of administrative tasks.
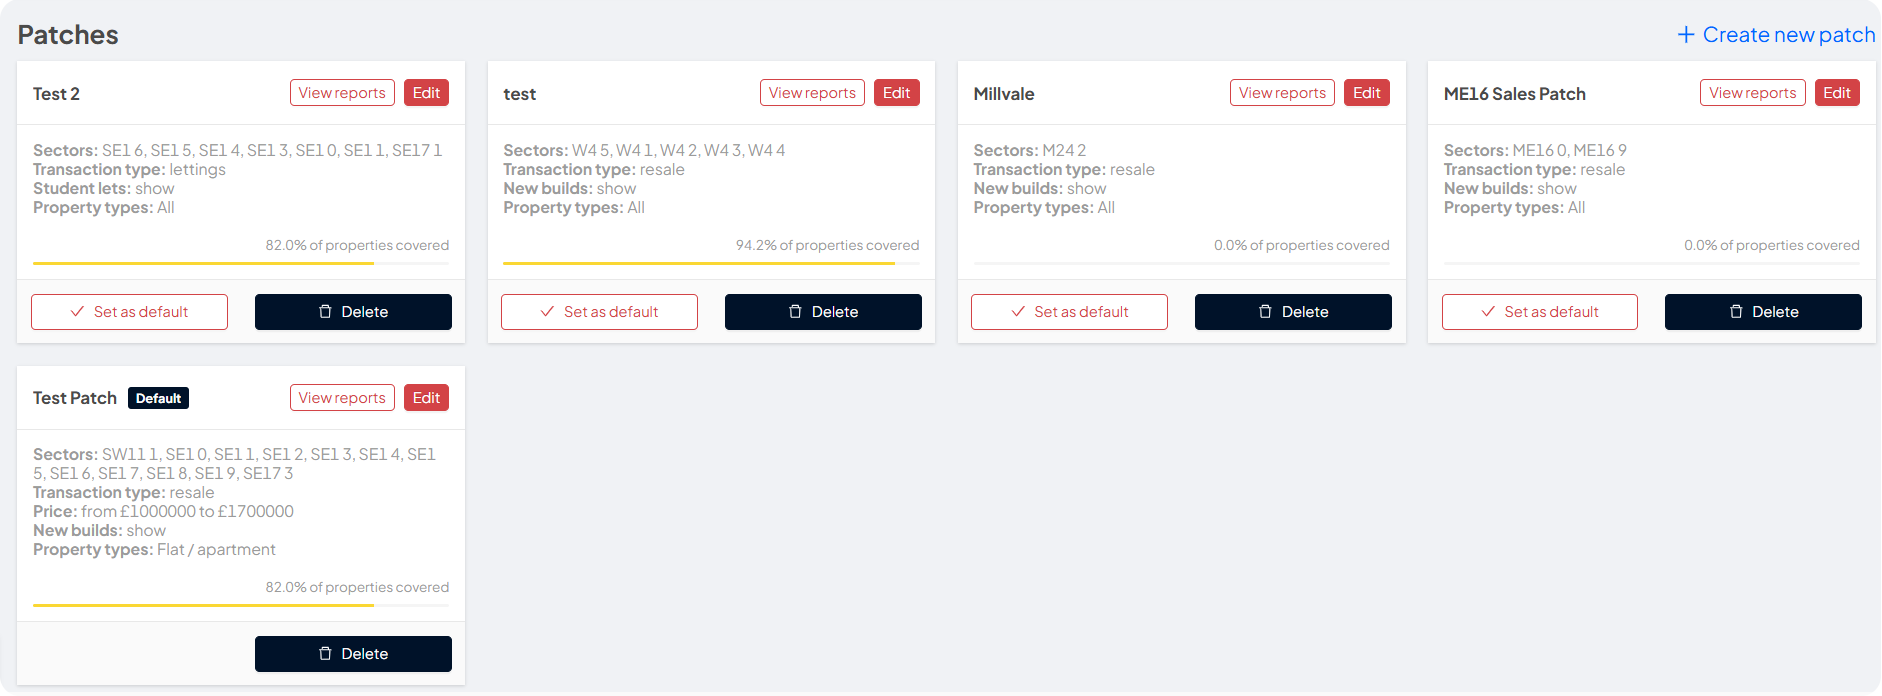
Create a new patch
Clicking on the Create new patch option will take you through to the patch creation map. There you’ll be able to set up a new patch following the instructions on the previous tab.
Edit patch
Selecting Edit on an existing patch, will take you through to the patch creation map. Here you can amend the sectors the patch covers, the filters and also the name of the patch. Once you’ve made your changes, click save.
Setting a default patch
Once you have a number of patches set up, you’re able to set one as a default. This will be the patch that is loaded onto the dashboard when signing in. The default patch will have a label next to it displaying such.
It’s possible to change the default patch using the Set as default button. Select this and the default label will move to the selected patch. Next time you log on, reports for that patch will appear at the bottom of your dashboard.
Deleting patches
If you no longer need a patch anymore, it’s possible to remove it from your account. To do this, simply select the delete button and confirm the selection.
Please note, this action cannot be reverted. Although it is simple to recreate any lost patches.
At the bottom of your dashboard, we use the patches you’ve set up to provide useful information about your branch performance, compared to other agents offering properties in your patch. This will show the default patch selected, however using the dropdown next to Your patches heading, it’s possible to select a different patch to view your ranking. This can be useful if you have a sales and lettings department at your branch and want to switch quickly between results for each of them.
In the Your patch section, we report on three key areas where we show your ranking relative to other agents marketing properties in the selected patch.
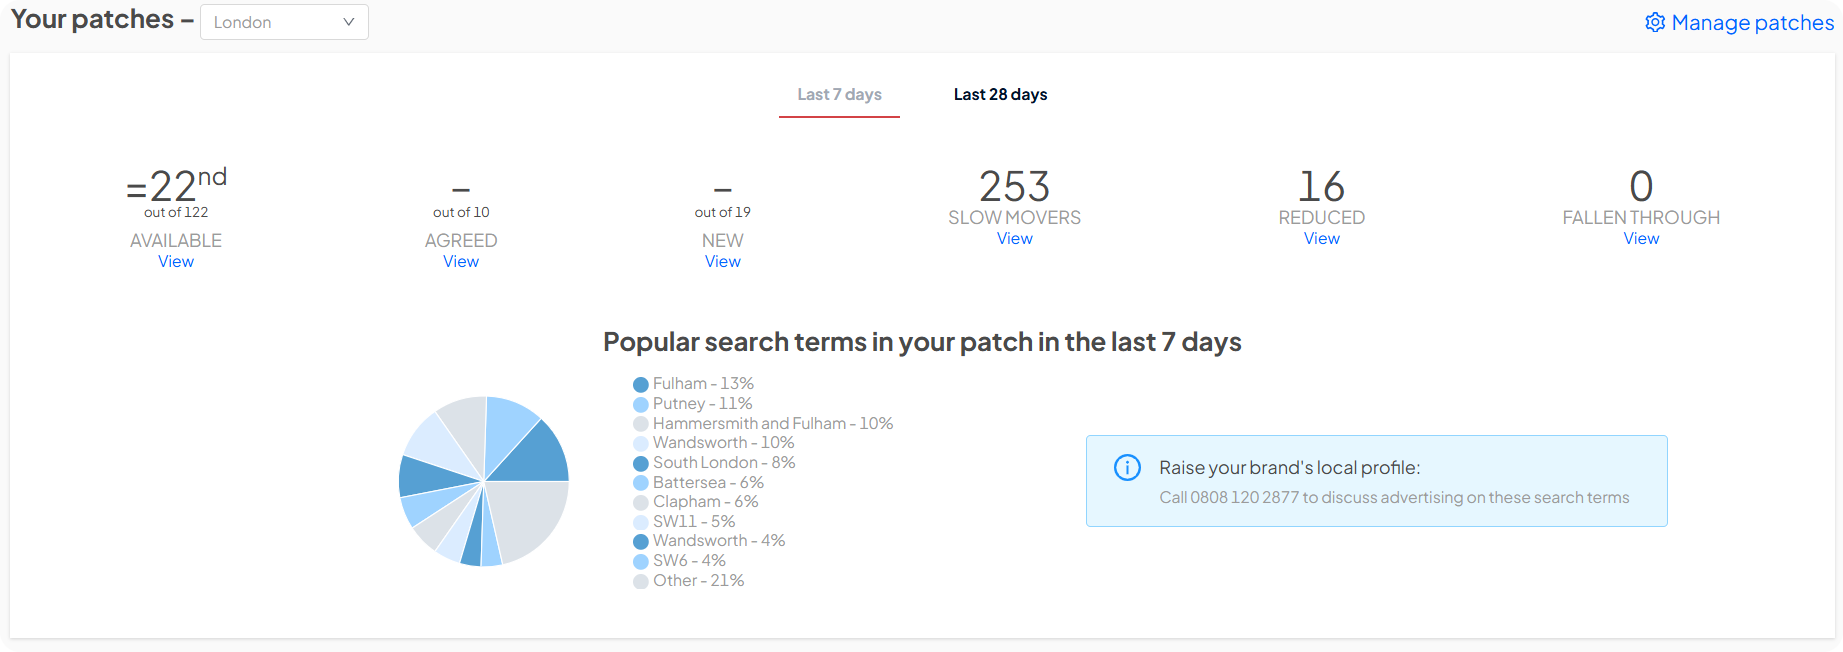
Available (market share)
This calculation looks for all properties that have been available in your patch during the last week
Agreed
This calculation looks for all properties that have been marked as SSTC, Under offer or Let agreed in your patch during the last week.
New
This measure looks for all properties that have been newly listed in your patch during the last week.
In addition, we provide three additional pieces of data which could be of use when looking at the current performance of agents and properties in your patch.
Slow movers
This is a count of properties in your patch that have been listed for 12 weeks or more.
Reduced
This is a count of properties in your patch that have been reduced in the last seven days.
Fallen through
This is a count of properties in your patch that were marked as SSTC or Let agreed but have been made Available again since.
Click on View under any of the measures and it’ll take you through to a more detailed report, where you can refine the results further. All of the reports work in a similar way, each having two views, which can be toggled using the option at the top right of the screen.
Summary view
This shows a chart of the numbers of properties per branch that meet the current criteria. Your position is highlighted in yellow. There’s also a table with a breakdown of the top 20 branches (this is configurable), the relevant number of properties for that agent and their market share. Results for agents outside the top 20 will be grouped under an Other category.
Detail view
This view lists the property information that meets the patch criteria. Displaying the address, outcode, price, number of bedrooms, property type and the listing agent, as well as a link to view the listing at OnTheMarket.com. The house number is not shown.
Map view
This view displays the properties in their locations on a map. You can click on the icons on the map to view each property at OnTheMarket.com.
Tailoring the reports
When the report first loads, it matches the filters that were set up originally for the patch. Using the filters on the right it’s possible to tailor the reports. Just click on the arrow to expand further. Changing these criteria will not update the criteria of the patch itself.
Date
The default for all reports is the previous seven days but it’s possible to extend this range to cover up to the last 12 months. The date range is used to look for any properties which were at, or changed to, the relevant status at any time during the date period. Whilst it’s possible to look at longer date ranges, we recommend looking at periods no longer than one month. This is particularly true for the available properties report, as this can result in significant volumes of property.
Department type
Toggle between the sales and lettings markets for the area.
Sectors
It is possible to look for date in up to 30 sectors, and there must be at least one selected for the report. In the search box, you can add a whole outcode and then toggle sectors with that outcode or you can add one sector at a time.
Price
Set a price range for the report. If looking at the rental market, the report is based on equivalent price per calendar month. Please note, the listing may be publicly advertised under a different rental frequency however, to allow comparison, all prices have been converted to a price per calendar month (PCM) in this report.
Bedrooms
Set the range for the number of bedrooms in the property. Zero includes land, commercial, and studio apartments where relevant.
Property types
Select as many property types as required. By default, all are selected.
Maximum number of agents
In some patches, there may be a significant number of agents which make the results difficult to read. To help summarise the data we limit the number of results to the largest 20 agents in each patch and then group all others in a single result. Using this filter, it’s possible to increase or decrease the number of individual agents shown on reports before we start to group them. If your agency is outside of the maximum number, we will always show your results, so you can still compare.
New build/ New homes
If the sales version of the report is selected, it’s possible to filter new builds. By default these are included, but it’s possible to display only new builds or exclude them from the results.
Student lettings
If the lettings version of the report is selected, it’s possible to filter student properties. By default these are included, but it’s possible to display only student lettings or exclude them from the results.
Time on market
This filter is only available on the slow movers report. The default for the report is to look for properties that have been available for more than 12 weeks. You can amend the time period by changing the value in this filter.
After making any changes to the filters you will need to click Update to refresh the report data. This option will only display if changes have been made to the report. To cancel or make further changes before the report is returned, simply click Cancel when it appears.
To show potential vendors and landlords your success in a particular area, you can print a summary report to show your ranking compared to other agents.
Once you have set up the report with the correct filters, click on Generate certificate when it is available. This option will only display when viewing the available, new and sold reports. It’s only possible to access this feature when your agency appears within the result set.
The certificate will appear in a new tab as a PDF, where it can be downloaded or printed. On the certificate we anonymise other agents and therefore, this is the only version of the report that can be shared externally.
View PDF
On the Summary view of the report, there is the option to print the report as a PDF. This will produce a PDF of the pie chart and summary table. This report contains information that may not be shared externally and therefore is marked ‘for internal use only’.
Export to CSV
On the Detail view of the report, there is the option to export all of the individual properties into a CSV file, should you wish to filter or sort in other ways we have not provided. This report contains information that may not be shared externally and is only for internal use.
If you still need help...
Please phone us on 0808 1202 877 (option 2 for Technical Support) or you can email support@onthemarket.com.
Back to home
Related articles
Market appraisal guide: FAQ
How does the Sales Monitor took work?
What is the company and branch performance report?
What does ‘vs. similar’ within property performance mean?
What is the Supply & demand report?
Need to get in touch?
You can also give us feedback